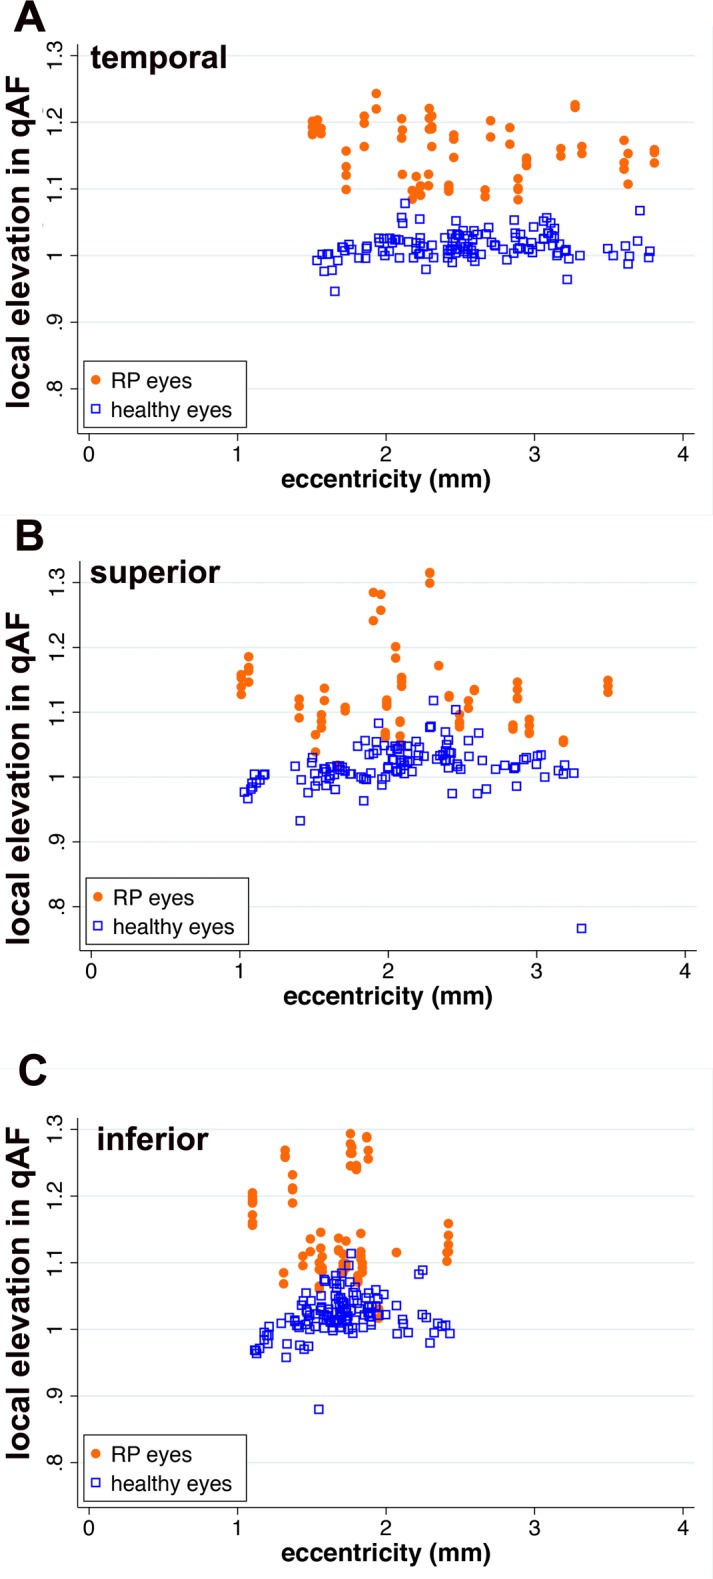
Figure 6.

Local elevations (contrast) of ROI-qAF associated with SW-AF rings in RP patients compared to healthy eyes at the same position. Local elevation is plotted as a function of eccentricity. Each orange dot and blue square represents one measurement per image. The local elevation was calculated according to Weber contrast.
