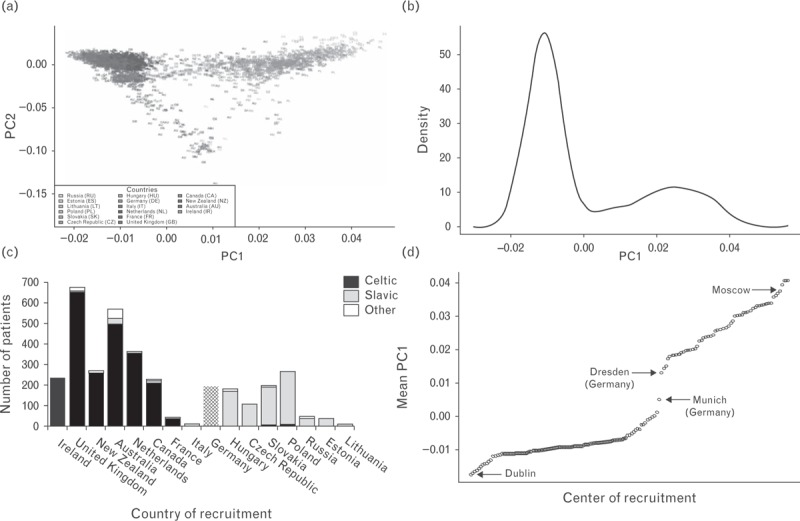
FIGURE 1.

Distribution of genotyped ADVANCE study participants (n = 3409) according to principal components of genotype structure using EIGENSOFT 3.0 package. (a) ADVANCE individuals are plotted against the first two principal components PC1 (west–east gradient) and PC2 (north–south gradient), (b) frequency distribution of study participants by value of PC1. (c) Distribution of principal component values by countries of recruitment of patients in ADVANCE. (d) ADVANCE recruitment centers ordered by mean value of PC1.
