
FIGURE 3.
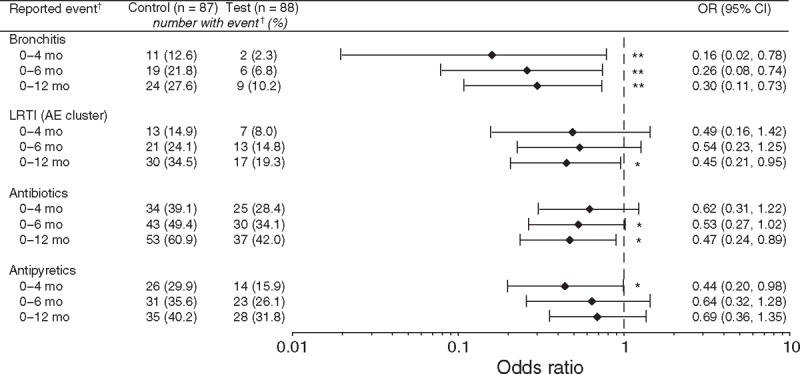
OR (with 95% CI) for parent-reported adverse events identified a priori and medication use in the test group compared with the control group. Analyzed using Fisher's exact test: ∗P < 0.05, ∗∗P ≤ 0.01. †Refers to parent-reported morbidity or medication use. AE = adverse event; CI = confidence interval; LRTI = lower respiratory tract infection; OR = odds ratio.