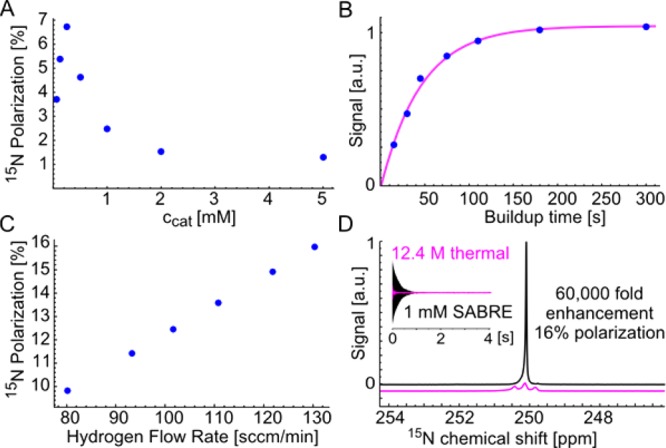
Figure 3.

(A) 15N polarization of 15N–CH3CN as a function of the catalyst concentration at fixed catalyst loading of 5 mol%. (B) 15N signal as a function of the buildup time (Tb = 40.8 s). (C) 15N polarization as a function of the hydrogen flow rate (cCatalyst = 0.25 mM, cPyridine = 0.25 mM, cBenzonitrile = 1 mM). (D) Comparison of a neat 15N pyridine reference (c = 12.4 M, pink, thermal 8.45 T, shifted by 63 ppm) and 15N spectrum of hyperpolarized benzonitrile (c = 1 mM, conditions as in C).
