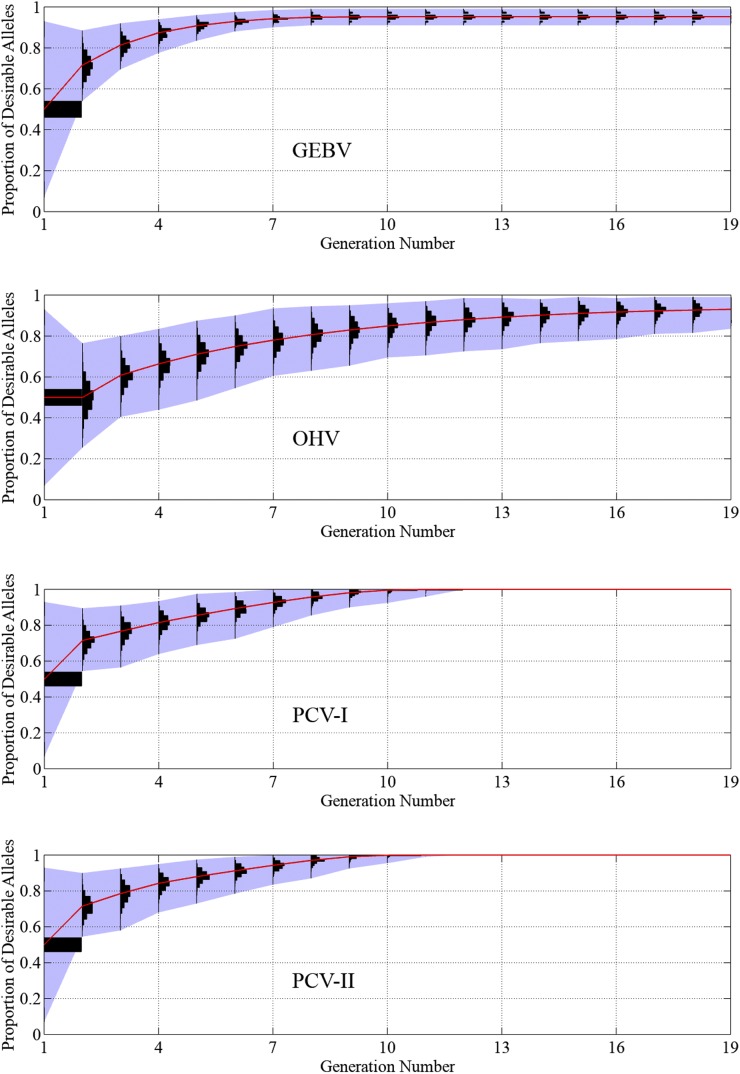
Figure 8.
Performance of the GEBV, OHV, PCV-I, and PCV-II approaches in 1000 simulation runs of trait introgression of seven QTL. The vertical axis represents the proportion of desirable alleles in the genome. Histograms of the proportion of desirable alleles among 100 progeny from 1000 simulation runs are plotted for each generation. The red curve shows the population mean.

