Figure 6.
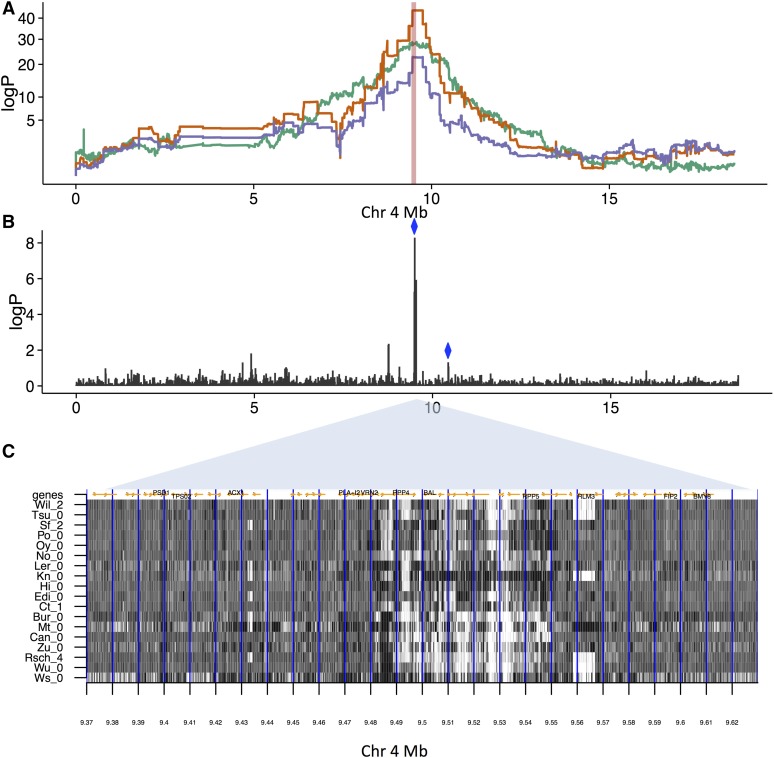
Effects of SVs on resistance to Albugo laibachii infection, (A) Genome scans on chromosome 4. Orange: Association with resistance. The peak of association for is at 9.50 Mb. Green: Association with SV-trait improperly paired reads at source 9.50–9.51. Purple: Resistance after two SV traits have been regressed out measuring improperly paired reads [sources chr4, 9.50–9.51 Mb (green line) and chr4, 10.44–10.45 Mb (not shown), both marked with blue diamonds in (B)] that together explain 24.7% of the phenotypic variance. (B) logP of association between SV traits for improperly paired reads and the resistance trait. There is a cluster of associated traits near 9.50 Mb, in addition to the more weakly associated trait at 10.44–10.45 Mb. (C) Structural variation in high-coverage sequence in the MAGIC founders ∼9.50 Mb. Shown is the number of improperly paired reads (dark: high values, light: low values) in 18 accessions (labeled on y-axis), between 9.37 and 9.63 Mb (x-axis). The 10 kb intervals used to define source loci are delineated by vertical blue lines. There is a region of complex structural variation spanning ∼9.48–9.55 Mb, with considerable variation between the founder accessions. Genes are marked by orange arrows, and selected genes, some implicated in disease resistance at this locus, are labeled.

