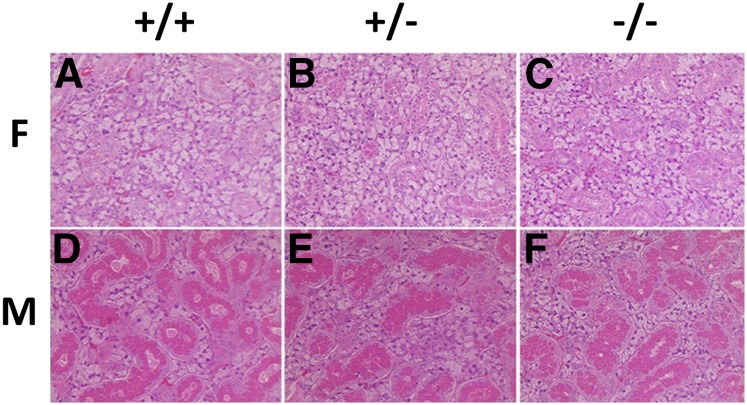
Figure 1.
H&Estaining of the submandibular glands of all three genotypes in both sexes. (A)–(C) are females and (D)–(F) are males, and genotype designations appear at the top of the figure. Males (D–F) show substantially more GCT (red) than seen in females (A–C). GCT, granular convoluted tubules; F, female; H&E, hematoxylin and eosin; M, male.

