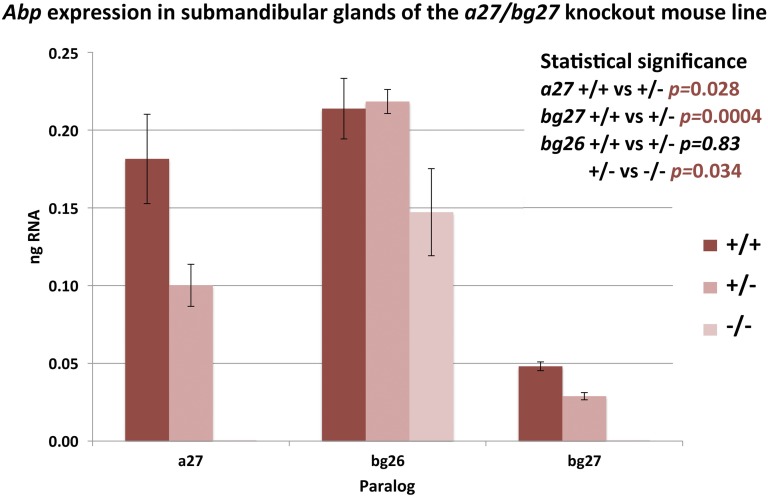
Figure 2.
Abp transcript expression in submandibular glands of the three genotypes. Expression levels of the three salivary Abp transcripts in the three genotypes were calculated using values obtained from qPCR with standard curves used as the method of optimization and verification for primer sets for each paralog. Male and female expression levels are pooled due to nonsignificant interaction between genotype and gender for the salivary Abp genes. SE bars are shown on the graph and ANOVA P-values comparing the means of the three genotypes are inset on the right, where the significant P-values appear in red typeface. qPCR, quantitative PCR.

