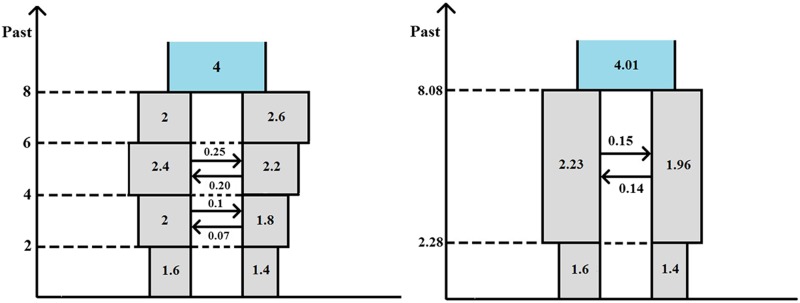
Figure 10.
Violation of demographic assumptions. Left-hand-side diagram: true model. Right-hand-side diagram: best-fitting IIM model. Divergence times are measured by twice the expected number of mutations per sequence, population sizes are represented by scaled mutation rates, and rates of gene flow by scaled migration rates.

