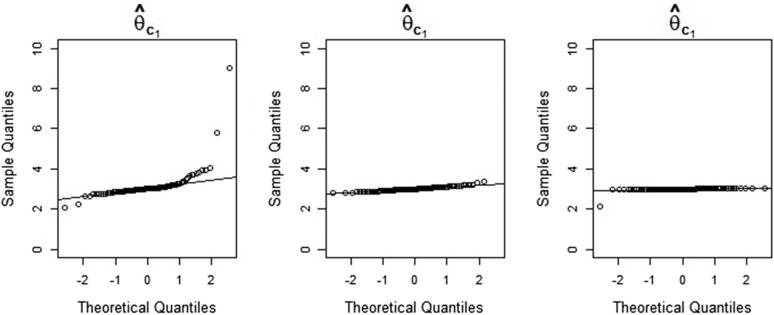
Figure 4.
Q-Q plots of maximum-likelihood estimates of the parameter obtained from simulated data, against the theoretical quantiles of the standard normal distribution. The estimates shown in the left-hand-side, center, and right-hand-side Q-Q plots are based on sample sizes of 8000, 40,000, and 800,000 loci, respectively. In the central Q-Q plot, one outlier with a value above 10 is not shown.

