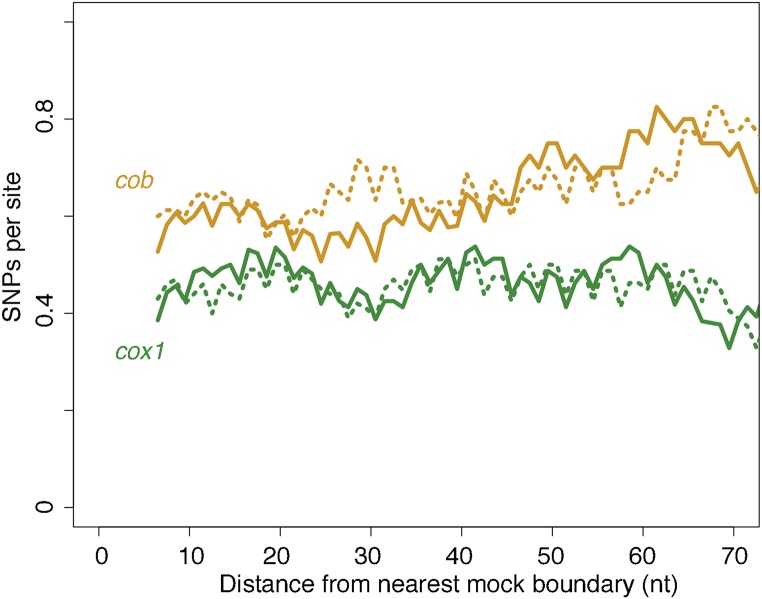
Figure 3.
No evidence for locally relaxed purifying selection at intron–exon boundaries. SNP density across human cob (yellow) and cox1 (green) coding sequences as a function of mock intron–exon boundaries introduced in silico (see main text), based on either intron positions in S. cerevisiae (solid lines) or L. kluyveri (dotted lines). Note that the 3-nt periodicity reflects the fact that the majority of introns occur in the same phase. The trend lines are smoothed density curves as described in Figure 1B.

