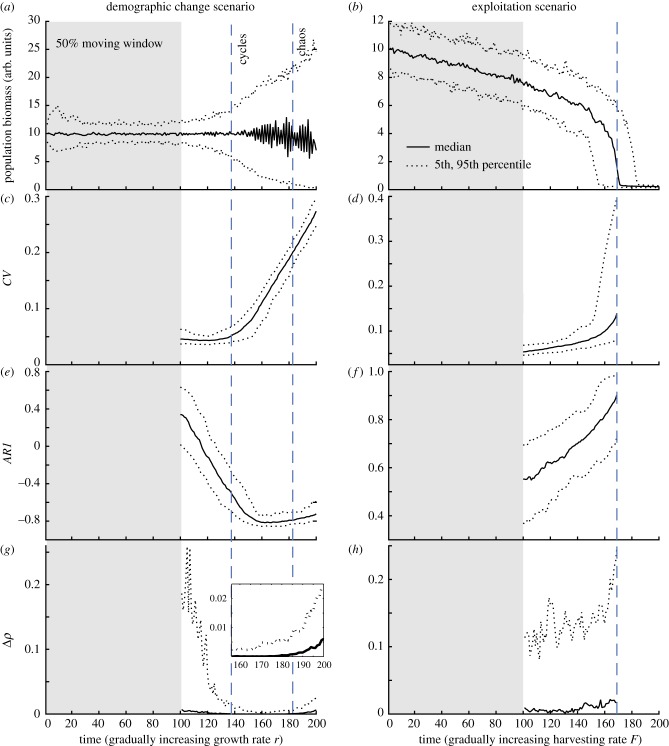
Figure 3.
CSD and nonlinearity indicators estimated within a moving window half the size of the time series. Time series are generated by linearly increasing growth rate r and harvesting rate F, respectively, over 200 time steps. (a,b) Population abundances, percentiles based on 100 simulations. (c,e,g) Demographic change scenario: blue dashed lines indicate the thresholds between cycles and chaos of the deterministic model. (d,f,h) Exploitation scenario: blue dashed line indicates the threshold at which 50% of the 100 populations collapse to the alternative overexploited state. CSD indicators: coefficient of variation CV and autocorrelation at-lag-1 AR1. Nonlinearity indicator Δρ. (Online version in colour.)

