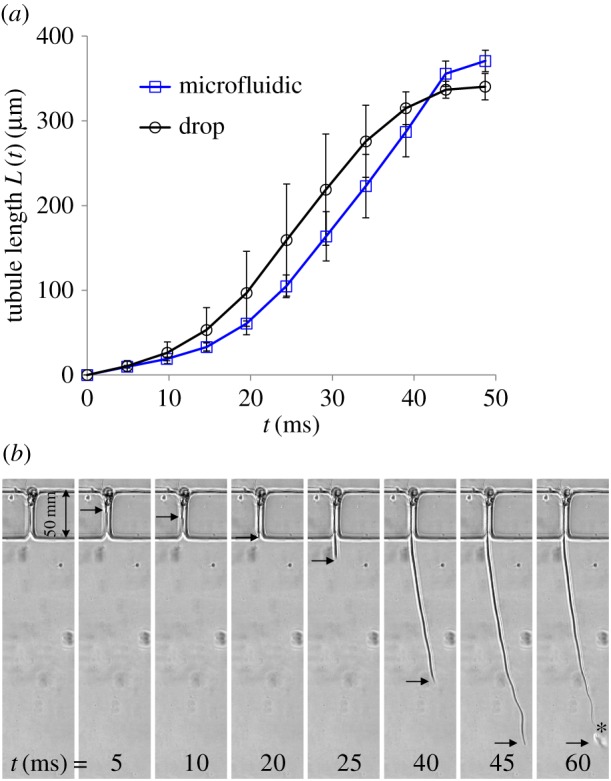
Figure 3.

(a) Measurements of tubule elongation as a function of time in the water–water experiments, comparing the results obtained in the microfluidic device with results obtained in an unconstrained water drop. Data are presented as the mean ± s.d., n = 5. (b) A sequence of images taken every 5 ms showing the elongation of the tubule in one of the water–water experiments. Elongation time is shown at the bottom. Black arrows indicate the location of the tubule moving front. Injected liquid appears as a bubble near the moving front on the last image (t = 60 ms), marked by an asterisk. The last image also shows that, following the release of the liquid, the tubule length is reduced.
