
Figure 4.
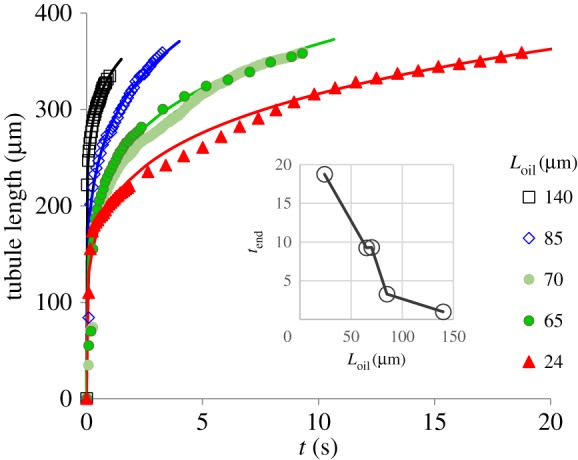
The tubule length as a function of time in the water–oil experiments. Each of the five experiments was conducted for a different Loil (see table 1; electronic supplementary material, video). Symbols represent measured data and lines were plotted by equation (3.5) and the data in table 1. The inset shows tend of the five experiments.