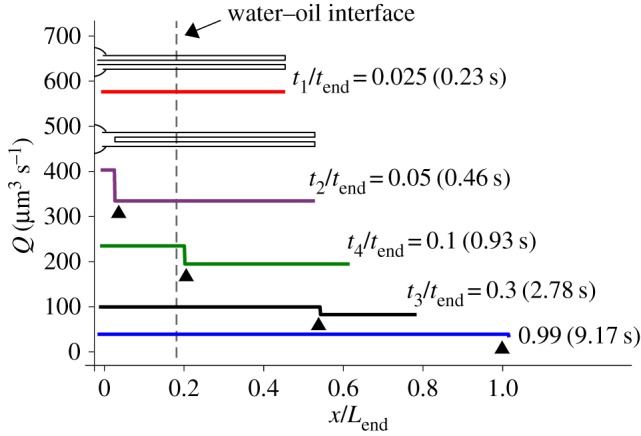
Figure 6.

The flow rate, Q, of the pγGlu solution, along the normalized tubule length (x/Lend) at five different times during tubule eversion as computed by equations (3.3) and (3.4) for the 65 µm experiment. tend is the total release time, Ri = 0.15 μm and Jw = 0. Schematics show the length of the folded part of the tubule in the first two instants. Arrowheads indicate the location of the tubule trailing end where the cross-sectional area changes from an annulus to a full circle. Note that, for t/tend = 0.025, the rear part of the tubule is still in the capsule and no step is shown.
