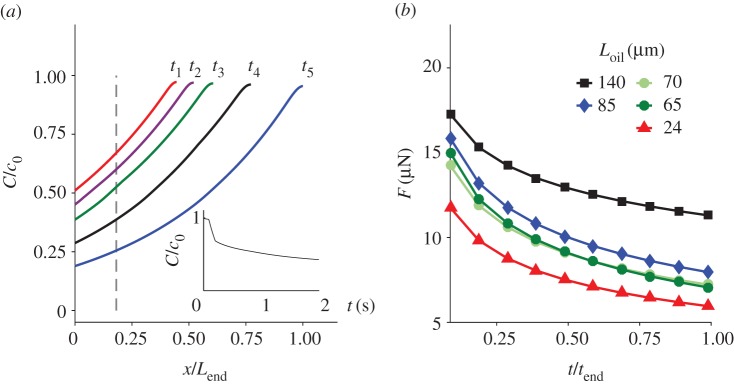
Figure 7.
(a) Normalized pγGlu concentration, C/c0, under the same experimental conditions as in figure 6. The inset shows the temporal evolution of the concentration at the water–oil interface, Cdrive/c0. (b) The driving force of the tubule elongation, calculated using equation (4.4) for all five experiments, given Ri = 0.15 µm and Jw = 0.

