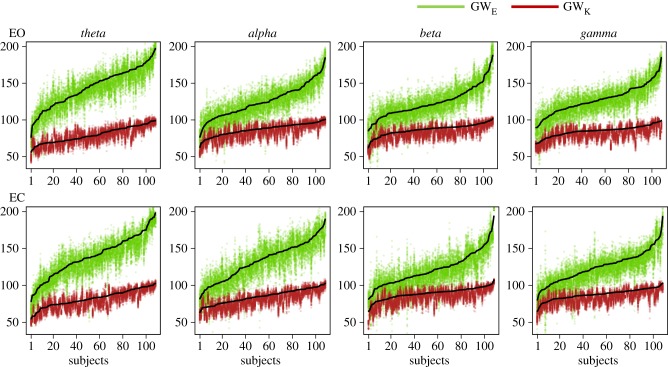
Figure 4.
Adequacy of the model configuration M1. Green and red dots represent, respectively, the values of the geometrically weighted edgewise shared pattern distribution (GWE) and the geometrically weighted degree distribution (GWK) measured in simulated networks. Black dot lines indicate the values measured in the observed brain networks.

