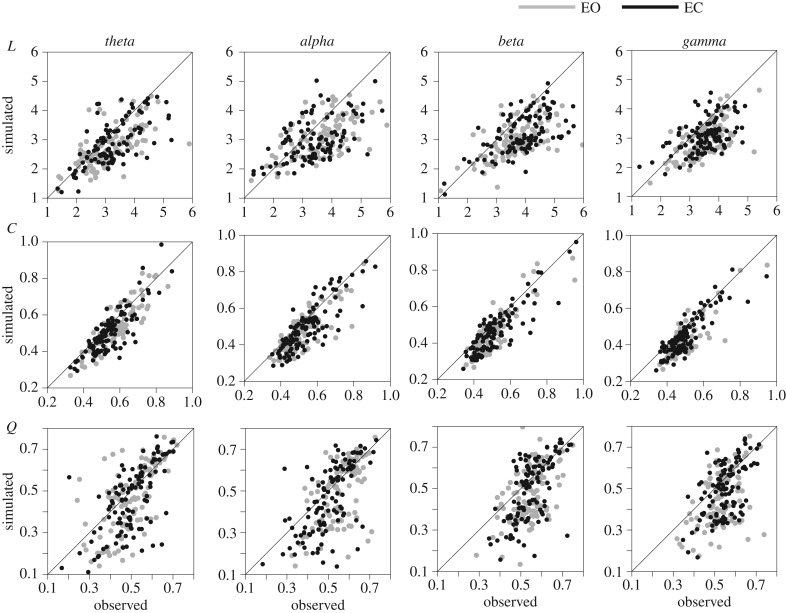
Figure 5.
Cross-validation for the model configuration M1. Scatter plots show the values of the graph indices measured in the observed brain networks (x-axis) against the mean values obtained from synthetic networks (y-axis). Three graph indices were considered: characteristic path length (L), clustering coefficient (C) and modularity (Q). Grey dots correspond to eyes-open resting states (EO); black dots correspond to eyes-closed resting states (EC).

