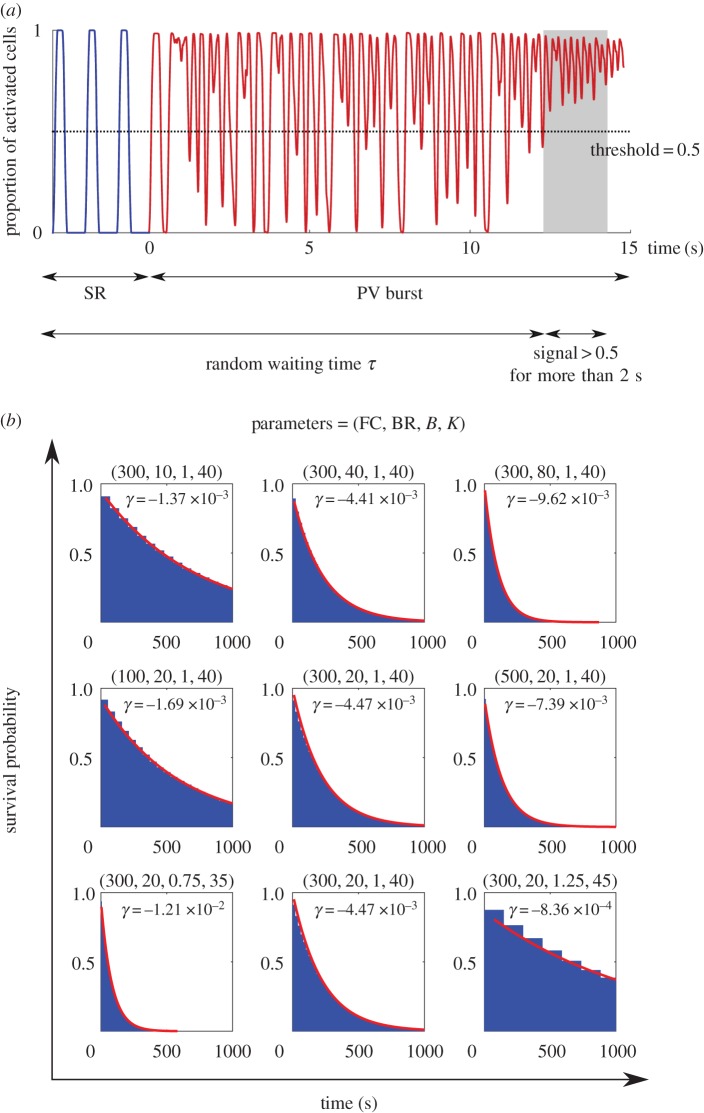
Figure 4.
(a) The second classifier identifies the system as ‘in AF’ if the proportion of active cells is greater than 0.5 for more than 2 s. (b) The onset time of AF is a random time τ, and the cumulative distribution of τ is plotted for selected parameter sets. The data were fitted by an exponential function  . Note that when we varied BR, the cumulative distribution was monotonically decreasing for any given time. This indicates that the second classifier identifies the transition rate to enter AF is a monotonic increasing function of BR, in contrast to figure 3 where AF is mostly induced at the intermediate regime of BR.

