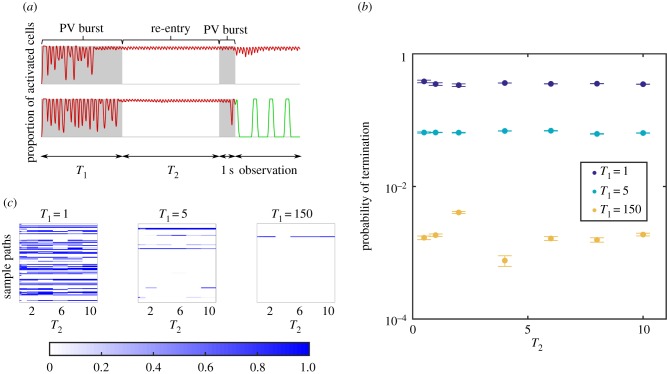
Figure 7.
(a) Schematic diagram of the protocol to probe spontaneous termination. We turned on PV bursts for a duration T1 (unit: s), to obtain sample paths which initiated AF. For these, a second PV burst of duration 1 was applied, following a waiting window of duration T2 (s). Termination probability was measured in the 10 s window after the second PV burst. (b) The termination probability across all sample paths depends on T1; in contrast, the value of T2 does not change the termination probability significantly. (c) We performed 50 trials for T2 = [0.5, 1, 2, 4, 6, 8, 10], for each sample path in AF after the first PV burst. Probability of AF termination for each sample path (single line), as a function of the sample path and T2, is shown in the heat map. Strong correlation in the horizontal direction suggests two subpopulations: stable AF which cannot be terminated, and unstable AF which can be terminated, regardless of the T2 value. The results suggest the subpopulation of stable AF increases as T1 increases.

