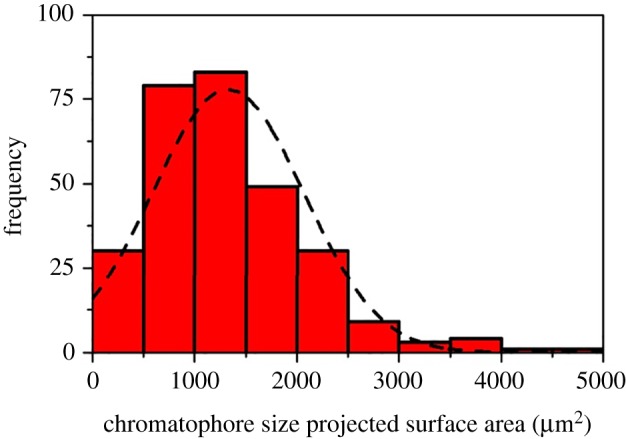
Figure 5.

Size–frequency distribution of GFP containing chromatophore system of Favites abdita. Chromatophore size is calculated in relation to the projected two-dimensional surface area (square micrometre). Chromatophore identification is based on image analysis shown in figure 4. (Online version in colour.)
