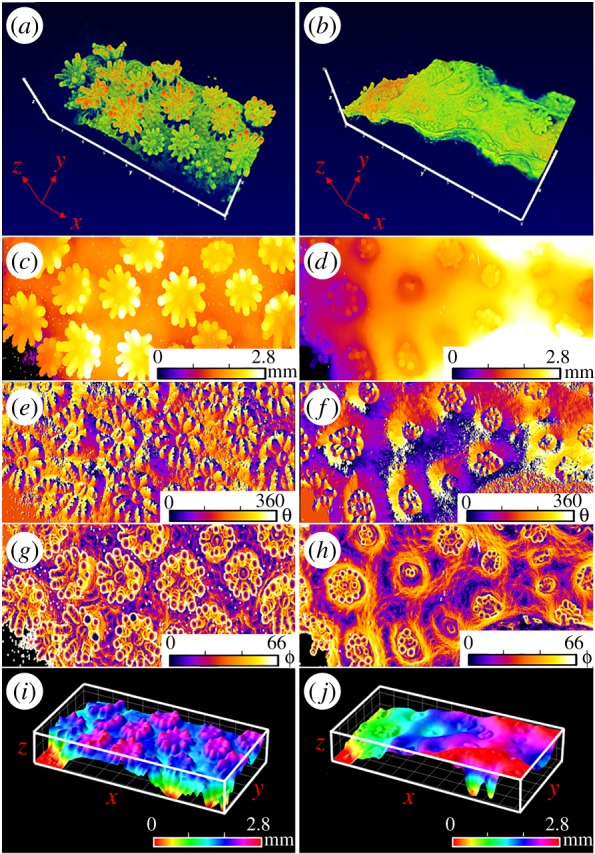
Figure 7.

OCT-based surface area characterization of expanded (a,c,e,g,i) versus contracted coral tissue (b,d,f,h,j). (a,b) Three-dimensional OCT scan (x,y,z scale bar, 1 mm). (c,d) Topographic height map (z = 0–2.8 mm in false colour coding). (e,f) The gradient analysis (see Material and methods section) calculated the azimuthal angle θ showing the surface direction from 0° to 360°, and (g,h) the polar angle ϕ showing the surface orientation from 0° to 66°. (i,j) The reconstructed three-dimensional tissue surface (see Material and methods section). The surface height z is shown in false colour coding for z = 0–2.8 mm. The field of view of the OCT scans was x = 3.4 mm, y = 7.7 mm and z = 2.8 mm.
