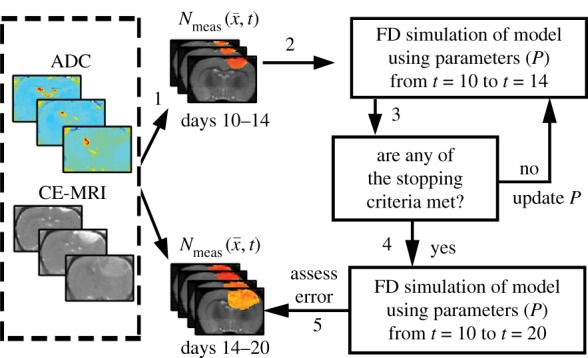
Figure 2.

Flow chart for parameter optimization of the tumour models. ADC values are used to calculate cell number within regions of interested identified in CE-MRI, step 1. A FD simulation, step 2, is then initialized with  and an initial guess of P to simulate N at days 12 and 14 (
 ). The stopping criteria, step 3, are then evaluated. When the stopping criteria are met, step 4, the optimized P is used in an additional FD simulation to simulate
  at days 10 to 20, step 5, otherwise P is updated and the optimization continues. (Online version in colour.)
