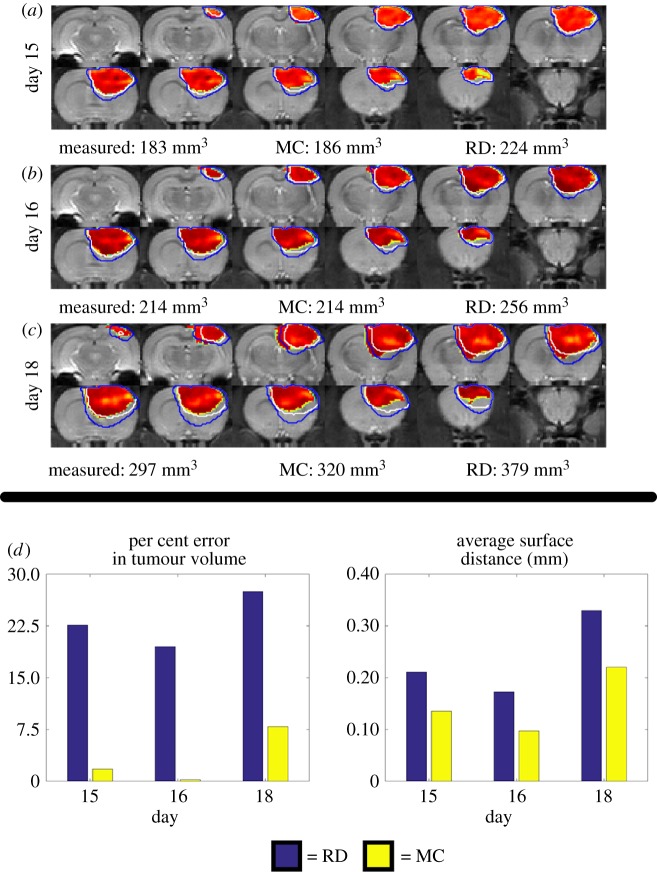
Figure 3.
Global error analysis for the MC and RD models. Rows (a–c) show  with two outlines representing the simulated tumour spread for the
  (blue lines) and the
  (white lines) over the entire tumour volume at days 15, 16 and 18 for rat 7. The measured, MC, and RD tumour volume values for each day are displayed below each row. The MC model has less than 8% error at all time points, while the RD model has greater than 19% error at all prediction time points. Panel (d) quantifies rows (a–c) by showing the per cent error in tumour volume (blue bars, RD; yellow bars, MC) and the average surface distance at days 15, 16 and 18. The MC model exhibits lower global level error (decreased per cent error in tumour volume and decreased ASD) compared to the RD model. (Online version in colour.)

