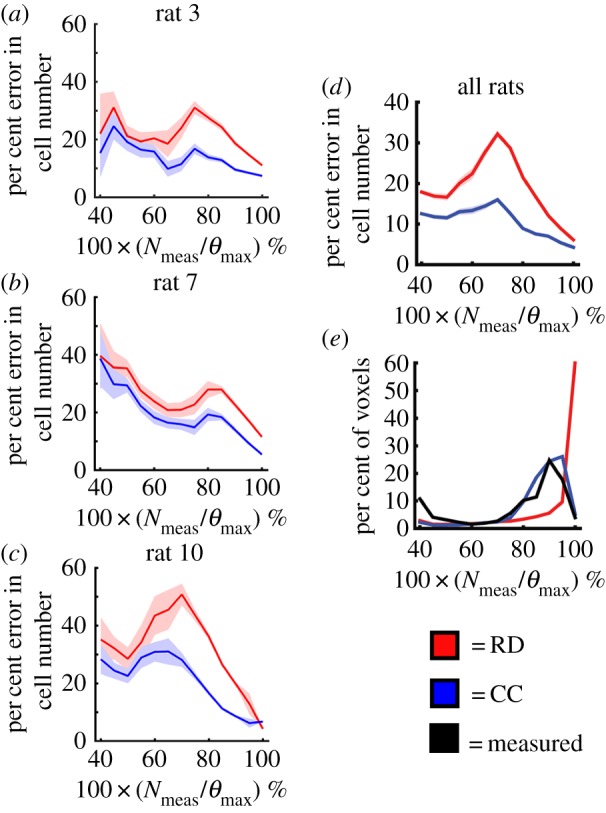
Figure 5.

Local error comparison for RD and CC models. Panels (a–c) show the per cent error in cell number (mean ± 95% CI) versus the voxel cell number as a percentage of the maximum carrying capacity for rats 3, 7 and 10 on day 16. The red lines represent the RD model, while the blue lines represent the CC model. The RD model has increased error at lower numbers (i.e. less than 80% of the carrying capacity), while the CC model has reduced error at all cell numbers. Panel (d) shows the results for the entire cohort (mean ± 95% CI). There are significant differences in the error distributions at each cell value. Panel (e) shows the distribution of cell number for the RD, CC and measured N (black lines) at day 16. (Online version in colour.)
