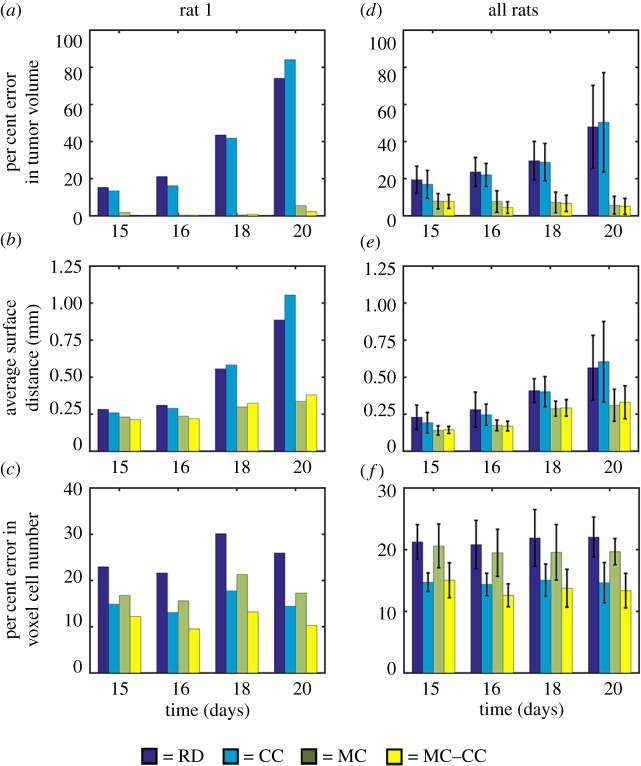
Figure 7.
Global and local error results for all models. Per cent error in tumour volume, panels (a,d), the average surface distance, panels (b,e), and the per cent error in voxel cell number, panels (c,f), are shown for rat 1, panels (a–c), and all rats, panels (d–f). For rat 1, increased global level error, panels (a,b), is observed for the RD and CC models compared to the MC and MC–CC models. Similarly, increased local error is observed, panel (c), for the RD and MC models compared to the CC and MC–CC models. Similar results were observed for the cohort. The mean and 95% CI are shown in panels (d–f). Increased error was observed in tumour volume, panel (d), for the RD and CC models (greater than 16%) compared to the MC and MC–CC models (less than 8%). Elevated average surface distances, panel (e), were also observed for the RD and CC models. Less than 16% error was observed at the local level, panel (f), for the CC and MC–CC models. (Online version in colour.)

