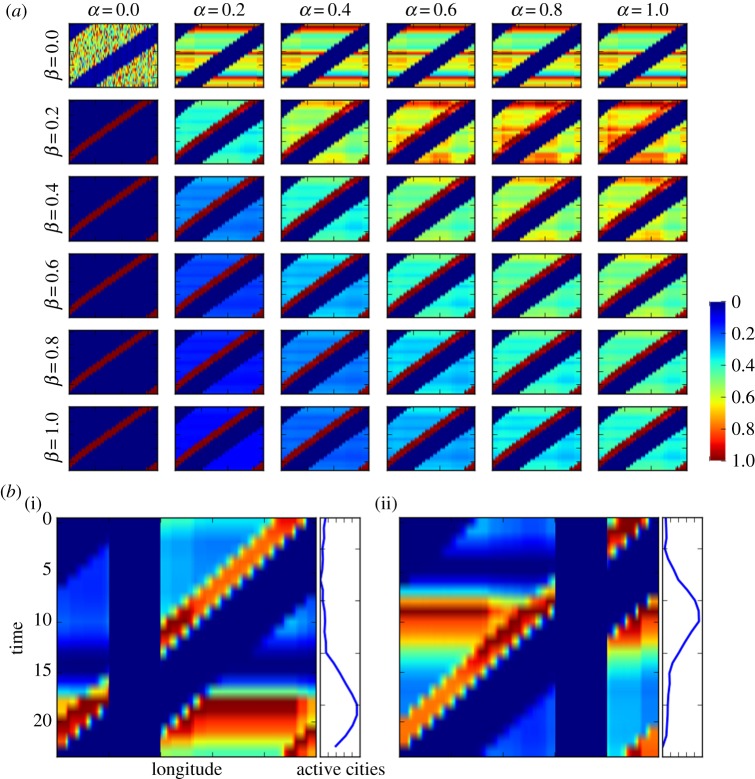
Figure 12.
(a) Model outcomes for multiple values of intercity influence at multiple longitudes (α) and night activity (β) with the same initial conditions. Longitudes are represented in the x-axis and universal time is represented in the y-axis (see (b)(i) for scale). Colours indicate the level of activity (scale shown in figure). We normalize the cities' activities by their maximum value. (b) Average model outcomes after introducing the effects of large inactive areas—oceans. Panels (b)(i) and (b)(ii) show inactive areas at different locations. Parameters α = 0.4 and β = 0.2. The blue series indicates the number of active cities (x-axis) at each time of the day (y-axis). Colour scale is similar to top panels.

