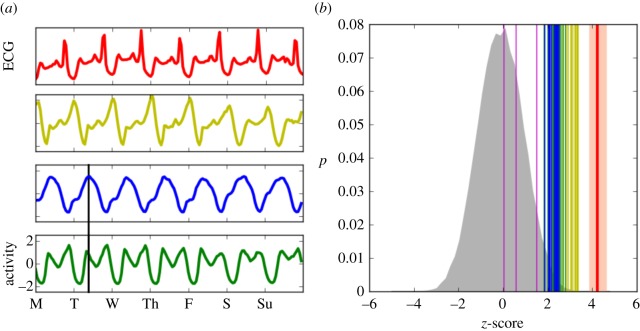
Figure 2.
Correlation of the temporal dynamics of cities and heart beats. (a) An example of heart beat ECG signal at approximately 80 beats per minute (red) and the average week of Twitter activity for three cities: São Paulo (yellow), Jakarta (blue) and London (green). Vertical black lines show the time of synchronization (see text). (b) Correlation of the heartbeat with 50 000 random series (grey curve), other heartbeats (red line), periodic signals (magenta lines, from left to right: sawtooth, squared and sinusoid), and all urban areas coloured by group determined by clustering analysis (see §3 and the electronic supplementary material).

