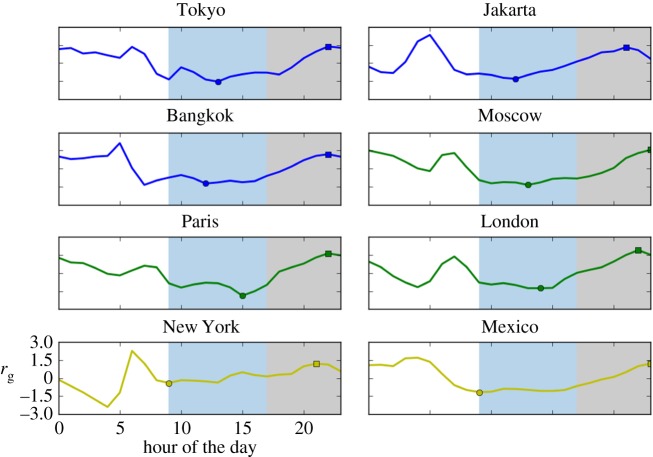
Figure 7.
Radius of gyration (rg) of tweets during an average day in major metropolitan areas. Series are shown in local time and have been rescaled by subtracting the average and normalizing by the standard deviation. Blue shading indicates standard work hours (09.00 to 17.00 h) and grey shading indicates standard recreation and rest hours before midnight. Colours indicate the results of the clustering algorithm (see §3).

