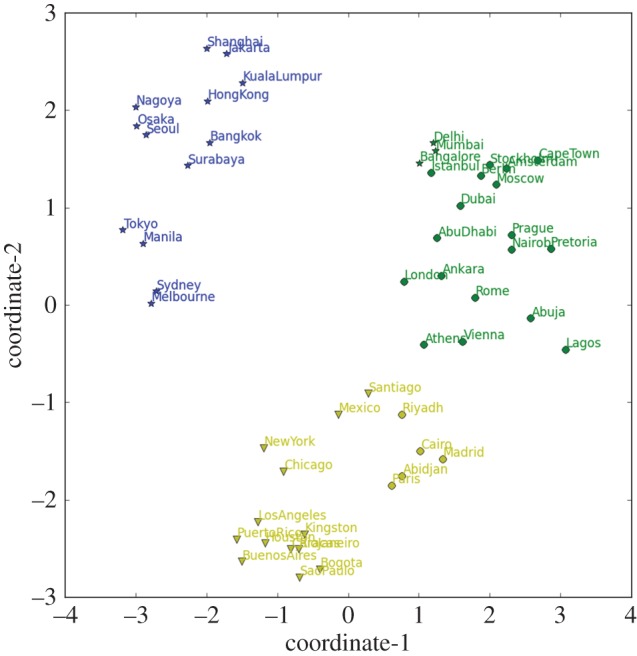
Figure 9.

Multidimensional scaling and clustering of city activity according to their time series vectors in local time. Colours indicate the results of the clustering algorithm (see text). Star symbols represent Asian and Oceanian cities. Circular symbols represent Middle Eastern, European and African cities. Triangular symbols represent South and North American cities. Axes correspond to reduced dimensions obtained from multidimensional scaling.
