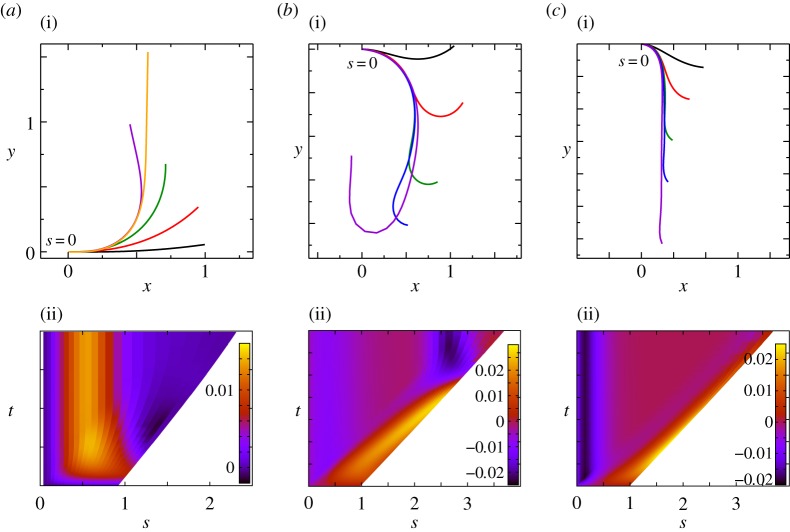
Figure 2.
The time evolution of scaled shapes of a growing shoot, with different colours representing shape at different times (i). Kymographs of the local curvature (κ) as a function of arc length (s) and time (t) are shown (ii) for the sensitivity parameter  and for various values of the elasticity parameter
  obtained by solving equations (2.1)–(2.7). (a) Vertically upward growth, with negative gravitropism, and
  , (b) transitional growth behaviour with an effective gravitropic ‘sign reversal’ and
  , (c) vertically downward growth, with effective positive gravitropism, and
  . (Online version in colour.)

