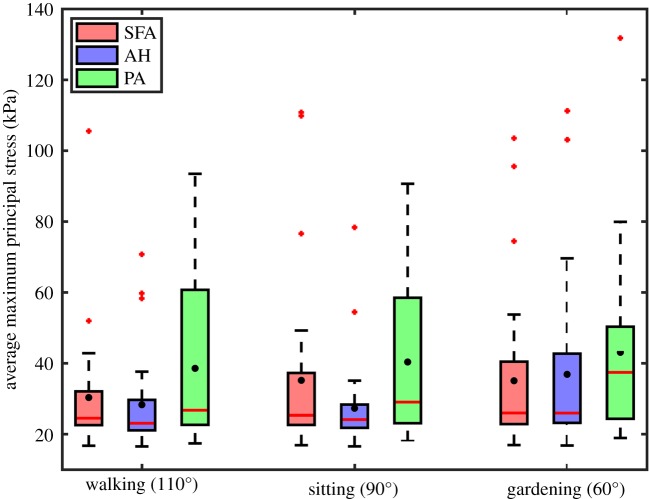
Figure 7.
Maximum principal stresses averaged through the thickness of the superficial femoral artery (SFA), adductor hiatus segment (AH) and popliteal artery (PA) during walking, sitting and gardening postures. Box extends to 25% and 75% confidence levels, whiskers depict data range excluding outliers, black dots correspond to mean values and horizontal bar represents median values. Outliers are marked with a plus symbol. (Online version in colour.)

