Figure 5.
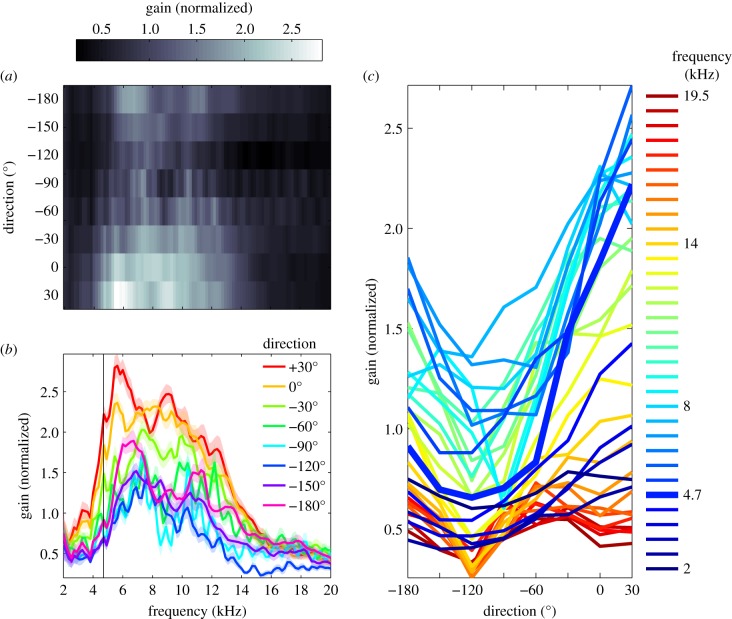
Average gains of tympanum displacements as a function of sound direction and sound frequency. Gains quantify displacement amplitudes divided by sound pressure amplitudes, normalized to the mean value for each cricket, and averaged for 20 individuals. (a) Average gains as a function of sound frequency and sound direction. (b) Average gains as a function of frequency for different sound directions (as indicated in the legend). Confidence intervals represent standard errors of the means for 20 crickets. (c) Same gain data as in (a) and (b), plotted as a function of sound direction, with frequency in kHz indicated in the legend. The calling song frequency is about 4.7 kHz, corresponding to the bold, blue line.

