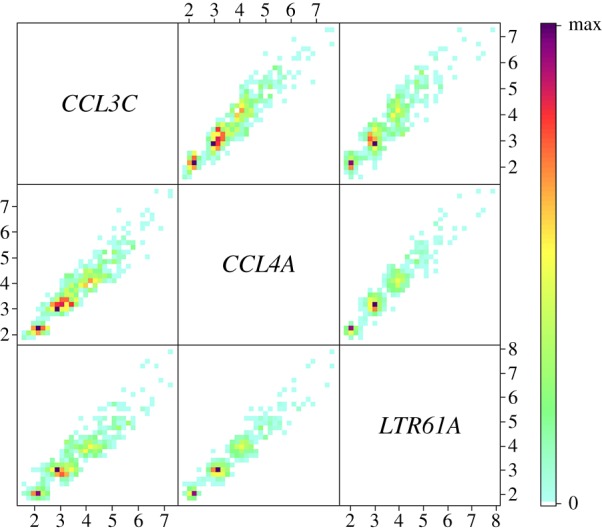
Figure 2.

Correlation of copy numbers for the three markers used to infer copy number of the CCL3L1/CCL4L1 region. Dispersion matrix of the normalized copy number values for CCL3C, CCL4A and LTR61A markers for 522 Native American individuals genotyped for the regions CCL3L1/CCL4L1. Colours correspond to point density. The high correlation (Pearson R2 > 0.91, p < 0.001) between the normalized CN values across the pairs of the three amplified loci suggests that in these populations, the region encompassing the CCL3L1 and CCL4L1 genes belongs to the same repeat unit.
