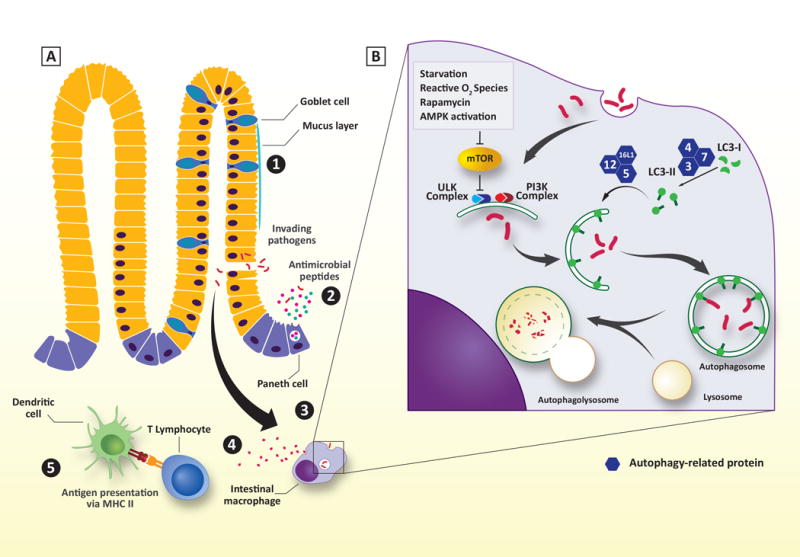
Figure 2. The stepwise process of autophagy and sites of dysfunction in IBD. (A).

Schematic representation of the intestinal border. Numbers indicate affected sites due to autophagic dysfunction in IBD. (1) Goblet cell function and mucus layer. (2) Paneth cell function. (3) bacterial clearance, ER stress response (not shown). (4) Cytokine production. (5) Antigen presentation by intestinal dendritic cells. (B) Overview of the stepwise process of autophagy. See text for detailed explanation.
