
FIGURE 2.
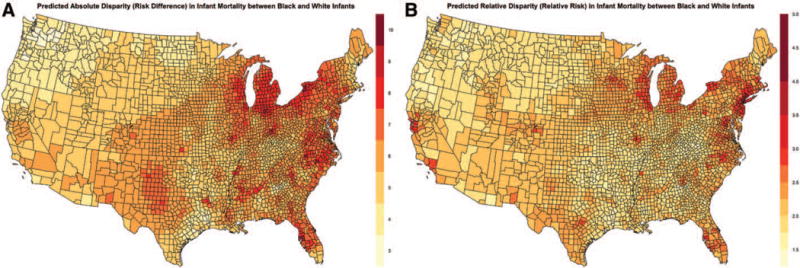
Posterior predicted absolute disparities (risk difference) by county in infant mortality rates (per 1,000) comparing black and white infants, 2004–2011 (A) and posterior predicted relative disparities (relative risk) by county in infant mortality rates comparing black and white infants, 2004–2011 (B) from the spatial shared component model.