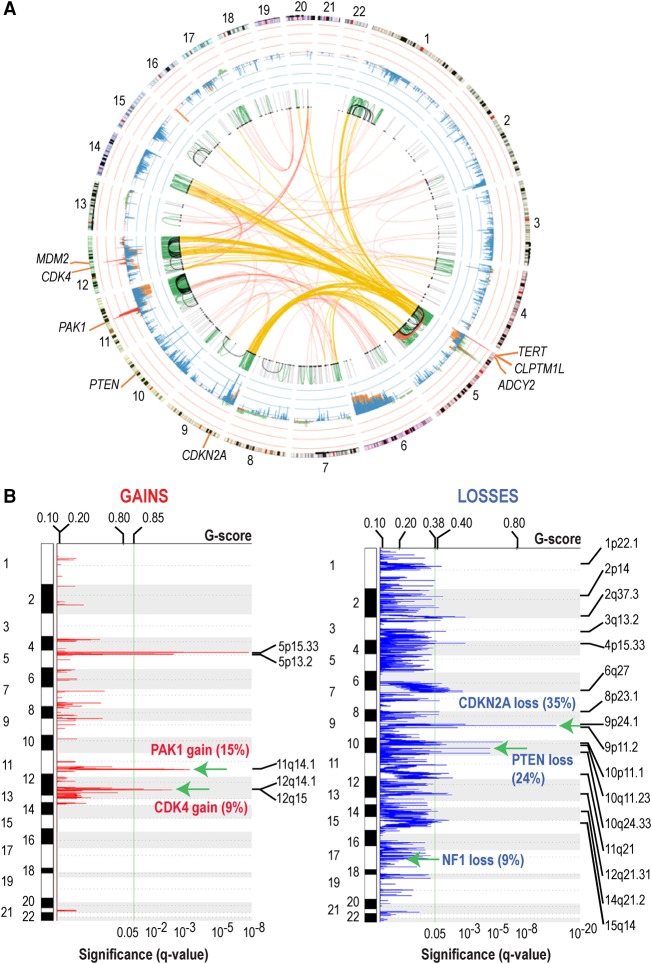
Figure 2.
Consensus somatic SVs and CNVs. (A) Summary of somatic SVs and CNVs. Intrachromosomal SVs: (gray) <1 Mb; (green) ≥1 Mb and <50 Mb; (black) ≥50 Mb and <100 Mb; (red) ≥100 Mb. Interchromosomal SVs are shown in red; interchromosomal SVs impacting Chr 5 are in yellow. Consensus CNVs are shown in the inner circle adjacent to chromosomes: (red) exome CNV gain; (green) LIWG CNV gain; (blue) exome CNV loss; (orange) LIWG CNV loss. (B) Consensus CNVs. Selected common gains and losses are indicated by green arrows. The percentage of impacted tumors is shown in parentheses. The plot shows the Q-values; Benjamini and Hochberg FDR (bottom) and G-score (top), with the copy number gains (left) indicated in red and copy number losses (right) in blue. Chromosome positions are indicated along the y-axis.

