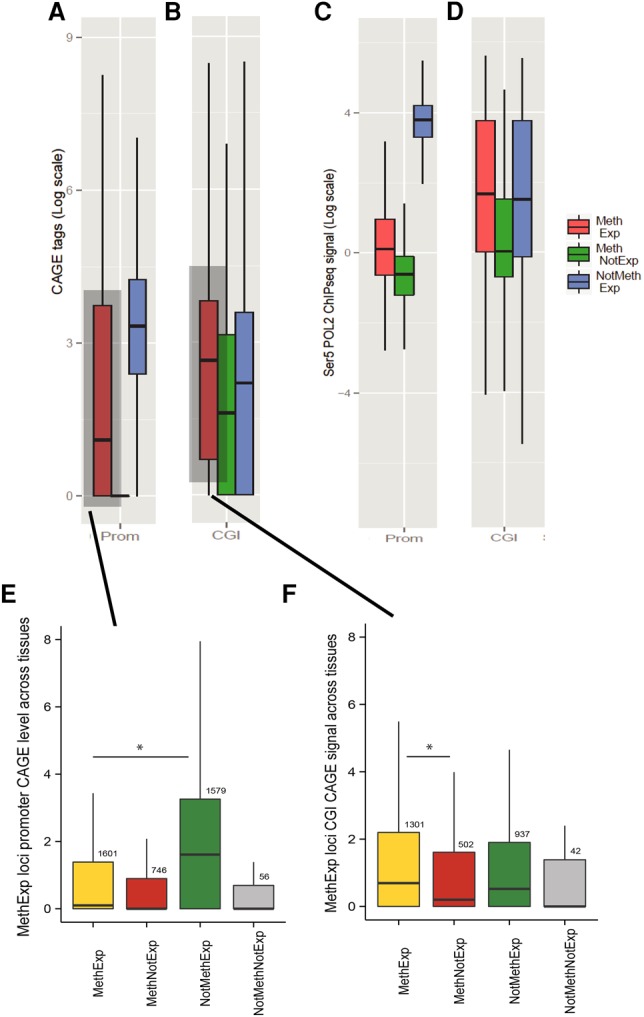
Figure 2.

Transcription initiation occurs at an upstream alternative CGI promoter and not at the proximal promoters of MethExp genes. The evidence of transcriptional initiation based on CAGE tag intensity (log-transformed y-axis) is contrasted for three gene groups, MethExp (red), MethNotExp (green) and NotMethExp (blue) at (A) the proximal promoter and (B) the distal CGI (x-axis). C and D are analogous to A and B, respectively, for observed levels of transcription initiation based on Ser5-Pol II ChIP-seq intensity. For the pan-tissue pooled set of MethExp genes, the plot shows the CAGE signal (y-axis) at the (E) promoter and (F) associated distal CGIs of these genes when they are MethExp (yellow), MethNotExp (red), NotMethExp (green), and NotMethNotExp (gray) in other tissues (x-axis).
