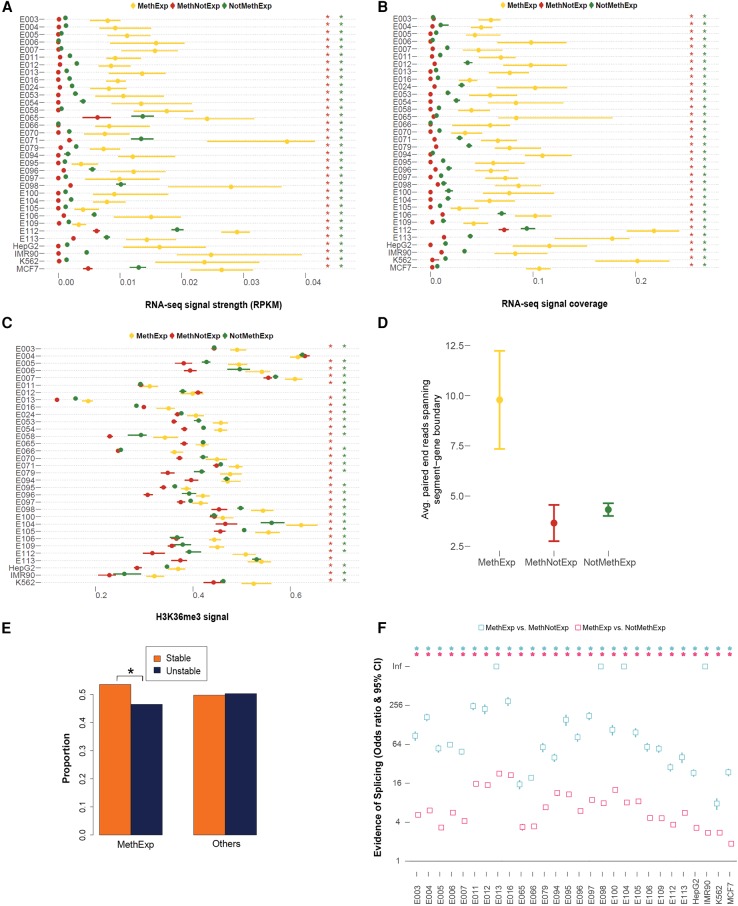
Figure 3.
Transcriptional elongation and splicing signals between CGI and the gene. (A) Median RNA-seq RPKM signal, (B) median RNA-seq coverage, and (C) median H3K36me3 ChIP-seq signal and 95% CI (x-axes) associated with the segment region of MethExp (yellow), MethNotExp (red), and NotMethExp (green) genes across 34 tissue types (y-axes). (D) The average number of paired-end RNA-seq reads (y-axis) whose ends lie in both the segment region as well as the annotated gene, as seen across MethExp (yellow), MethNotExp (red), and NotMethExp (green) genes across all tissue types (x-axis). (E) The proportion of “stable” (orange) vs. “unstable” (dark blue) transcripts (y-axis), as determined from a sequence-based predictor (U1-PAS motif order in segment region) in those genes that are MethExp in at least one tissue, versus other genes (Fisher's P = 10−5). (F) Odds ratio and 95% CI (y-axis) of the proportion of (1) MethExp versus MethNotExp genes (cyan), and (2) MethExp versus NotMethExp genes (pink) that show evidence of splice junctions between the segment region and annotated gene based on de novo transcript assembly across 28 tissue types (x-axis). An enrichment of such splice junctions in the segment region associated with MethExp genes corresponds to a higher odds ratio. Statistically significant associations (P < 0.05) are annotated with an asterisk in all plots, in a matched color scheme, wherever appropriate. In panels A through C, this color corresponds to the color of the background gene group that MethExp genes are contrasted against, i.e., a red asterisk to represent significant difference between MethExp and MethNotExp, and green for that against the NotMethExp group.

