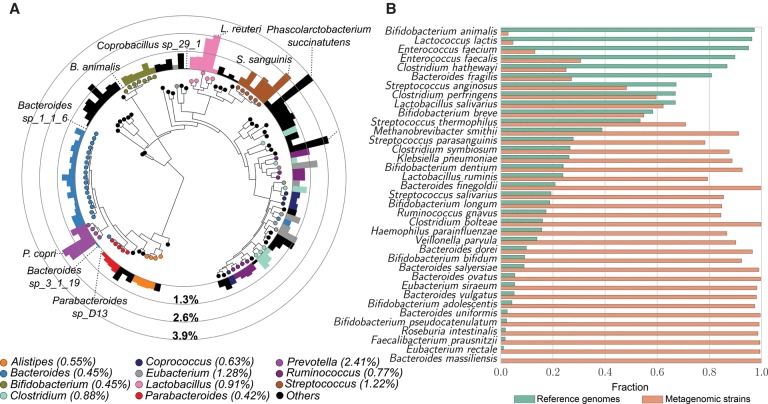
Figure 6.
Overall species diversity evaluated across intestinal samples and compared with the diversity available from reference genomes. (A) For the 112 species with concatenated marker length >10,000 nt, we built a phylogenetic tree using PhyloPhlAn (Segata et al. 2013) and GraPhlAn (Asnicar et al. 2015) and here report their median SNV rate computed on all pairwise comparisons in this sample set. The median SNV of each genus is reported in parenthesis in the legend. Species diversity ranges between 0.018% (B. animalis) and 3.9% (Phascolarctobacterium succinatutens) and is partially correlated with phylogeny (Bacteroides, Parabacteroides, Bifidobacterium, and Alistipes species show consistently lower diversity than Prevotella, Lactobacillus, and Streptococcus species). No significant correlation between diversity and total prevalence or average abundance was observed (Supplemental Fig. S45). Detailed information for each species is reported in Supplemental Table S9. (B) Fraction of total branch length spanned by strains sequenced as isolate reference genomes versus branch length spanned by strains from metagenomes. This figure includes species with at least 10 samples, three reference genomes, and concatenated marker length >10,000 nt. The complete set of species is provided in Supplemental Figure S46.

