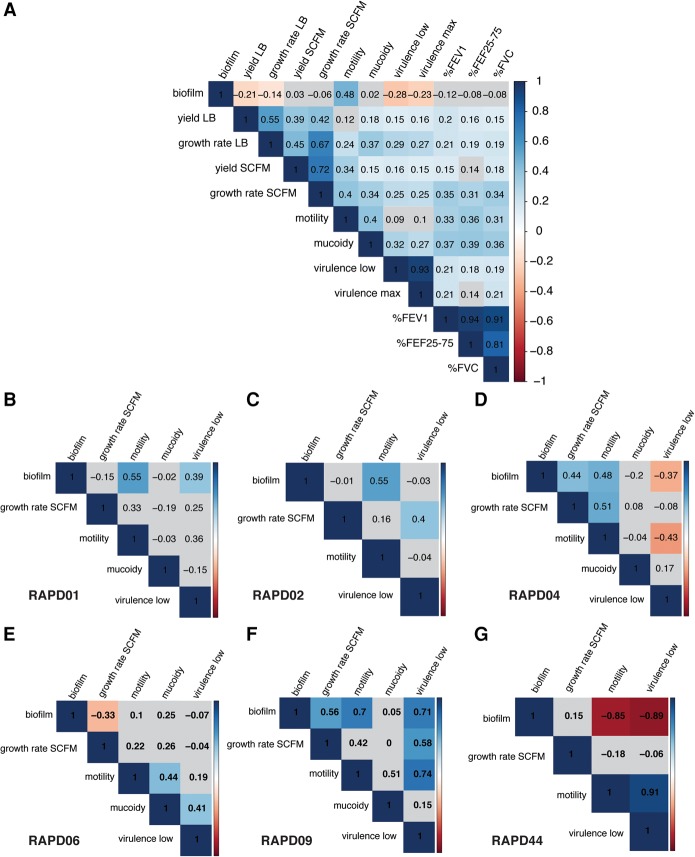
Figure 3.
Correlation matrices of B. cenocepacia phenotypes and patient lung function. Pairwise Spearman rank correlations of the five phenotypes are depicted as matrices for the following: (A) all isolates, (B) RAPD01, (C) RAPD02, (D) RAPD04, (E) RAPD06, (F) RAPD09, and (G) RAPD44. Blue gradients indicate significant positive correlation; red gradients, significant negative correlation; and gray, statistically nonsignificant correlation and P-value >0.05.

