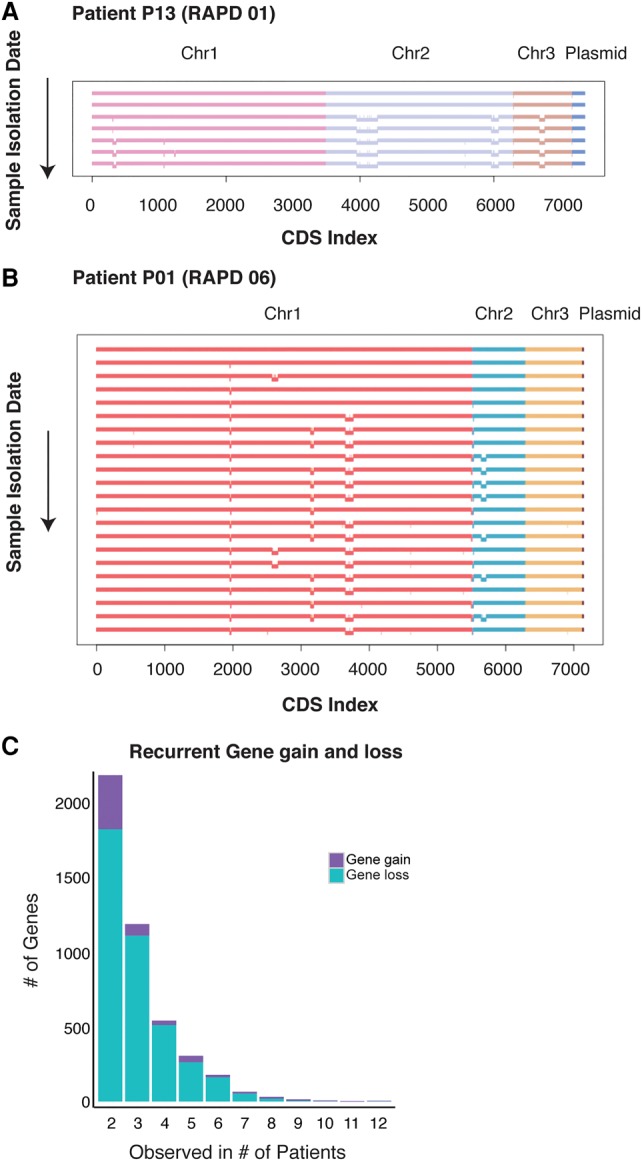
Figure 6.

Recurrent gene loss observed in B. cenocepacia longitudinal series. Each horizontal line represents the genome of one isolate from patient P13 (A) and patient P01 (B). Each isolate genome is arranged chronologically, with the earliest isolate at the top and the last isolate at the bottom of the figure. Each replicon is represented by a different color. Genome deletions are represented by the offset bars below each chromosome. (C) Histogram of number of recurrent gene loss (teal) and gene gain (purple) observed in two or more patients.
