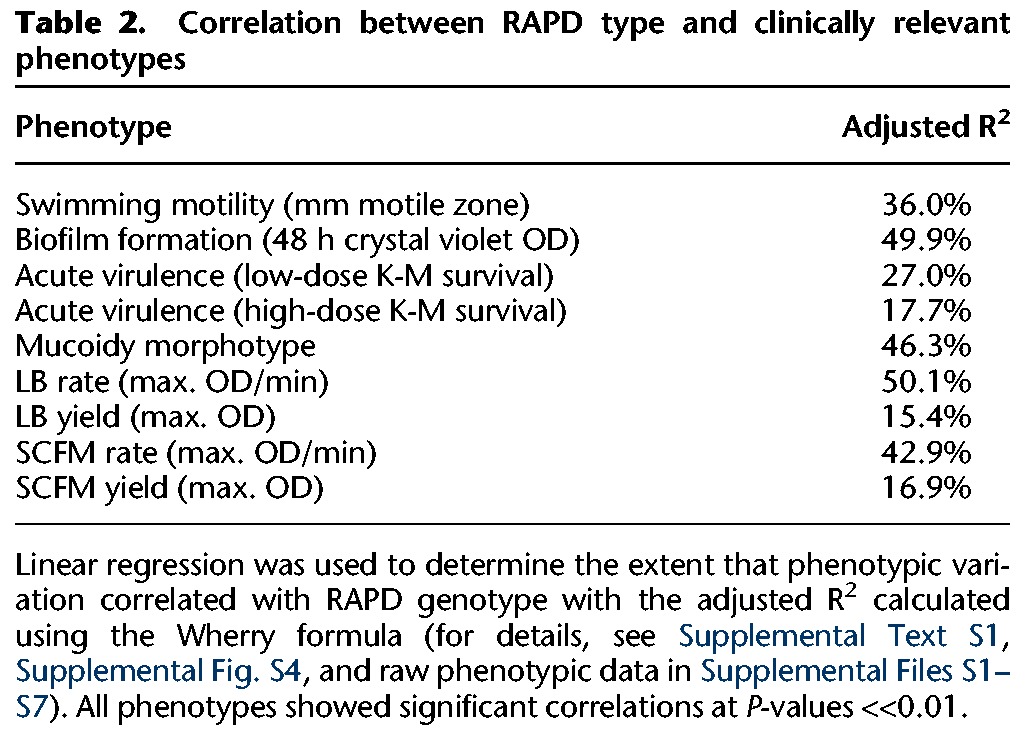
Table 2.
Correlation between RAPD type and clinically relevant phenotypes

Linear regression was used to determine the extent that phenotypic variation correlated with RAPD genotype with the adjusted R2 calculated using the Wherry formula (for details, see Supplemental Text S1, Supplemental Fig. S4, and raw phenotypic data in Supplemental Files S1–S7). All phenotypes showed significant correlations at P-values <<0.01.
