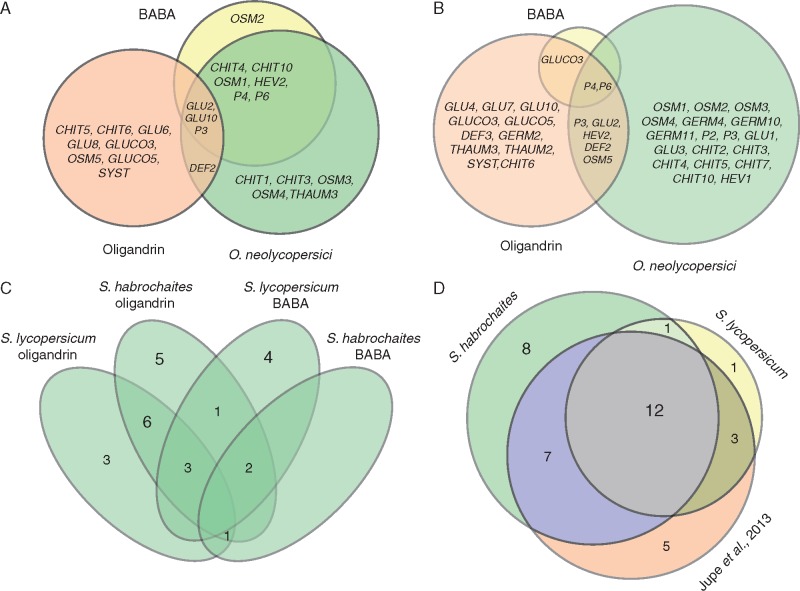
Fig. 5.
Venn diagrams showing the relationship among treatments. (A, B) Venn diagrams showing the transcript induction overlap of two inducers, namely BABA and oligandrin, and Oidium neolycopersici infection in Solanum lycopersicum ‘Amateur’ (A) and Solanum habrochaites (B) plants measured by RT-qPCR. (C) Overlap of induced transcripts in BABA- and oligandrin-treated plants measured by RT-qPCR. (D) Overlap of Phytophthora capsici-induced transcripts from the study by Jupe et al. (2013) with our results of O. neolycopersici infection of S. lycopersicum ‘Amateur’ and S. habrochaites plants. Transcript levels were measured 48 h after infection by microarray (Jupe et al., 2013) and RT-qPCR and compared to control represented by time zero.

