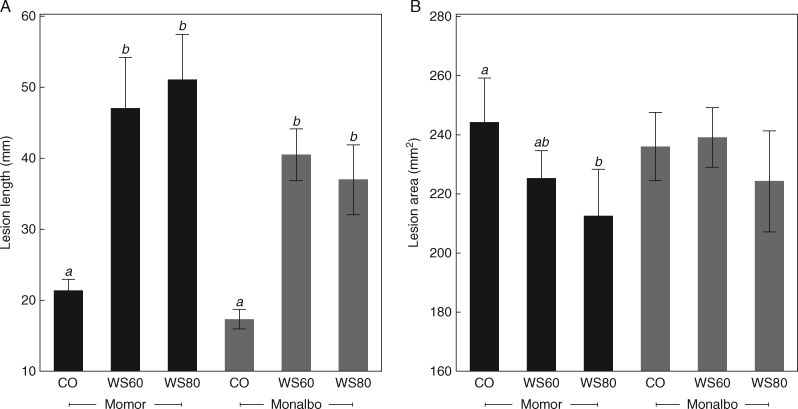
Fig. 4.
Disease severity caused by Botrytis cinerea on tomato stems (A) and detached leaves (B) under various water supply regimes. Data are from experiment E7. (A) Lesion length on tomato stems measured 7 days after inoculation of a highly aggressive strain (BC1) on petiole wounds of leaves 4 and 6. Each observation is the mean of the lesion length around the two infected petioles. CO: fully watered control plants; WS60: irrigation deficit of − 60 %; WS80: irrigation deficit of − 80 %. Each bar is the mean ± standard deviation of observations on five plants. Letters above the bars indicate significant differences between water treatments according to a Student Newman Keuls test, one test per cultivar. The test was repeated once with similar results. (B) Lesion area measured on tomato leaflets, 2 d after inoculation with a mycelial disc excised from a colony grown on PDA medium. CO: fully watered control plants; WS60: deficit irrigation of − 60 %; WS80: deficit irrigation of − 80 %. Each bar is the mean ± standard deviation of 25 observations per water treatment, on five leaflets of the 8th and 9th leaves sampled on five plants at 0 DPI, and ten leaflets sampled on ten plants at 3 and 7 DPI (five plants infected on petiole wounds and five plants mock-inoculated). Observations were pooled because no statistical differences were found between sampling dates or between infected and uninfected plants. Letters above the bars indicate significant differences between water treatments according to a Student Newman Keuls test, one test per cultivar. The test was repeated once (experiment E8) with similar results.

