Fig. 5.
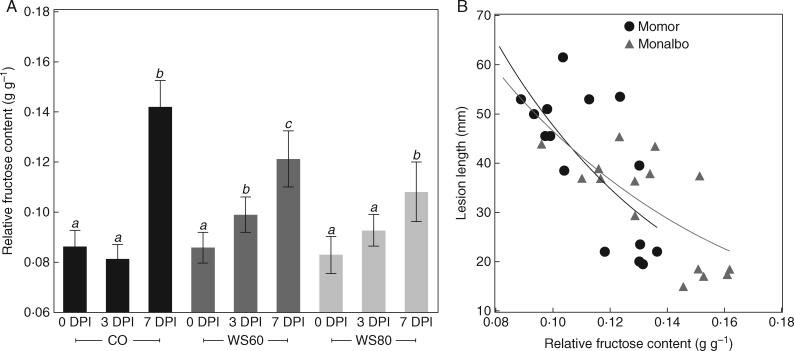
Evolution of relative fructose content (RFC) after infection and regression between RFC and disease intensity at 7 days post-infection (DPI) for plants grown under different water supply regimes. Data are from experiment E7 on ‘Momor’ and ‘Monalbo’. (A) RFC of tomato stems during the course of infection; CO: fully watered control plants; WS60: deficit irrigation of − 60 %; WS80: deficit irrigation of − 80 %. Each bar is the mean ± standard deviation of observations on five plants. Letters above the bars indicate significant differences between sampling dates according to a Student Newman Keuls test, one test per water treatment. (B) Plot of lesion length versus RFC. Lesion length on tomato stems measured 7 d after inoculation of a highly aggressive strain (BC1) on petiole wounds of leaves 4 and 6. Each observation is the mean of the lesion length around the two infected petioles. Each symbol corresponds to one plant. RFC and lesion lengths were measured on the same plants at 7 DPI. The solid line corresponds to exponential regressions [y = 226 × exp(−15·6x), f = 109, P < 0·0001, 15 d.f. for ‘Momor’ and y = 154 × exp(−11·9x), f = 123, P < 0·0001, 15 d.f. for ‘Monalbo’).

