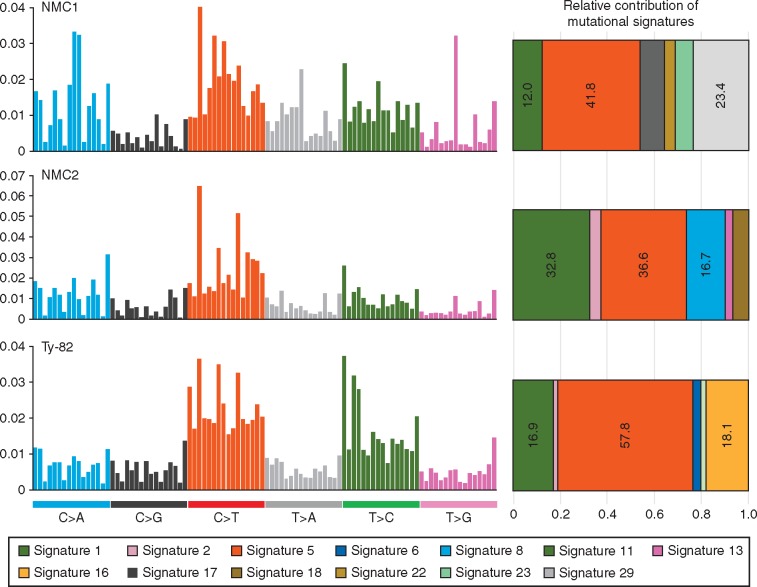
Figure 5.
Mutational spectra of NMC cases and contributing signatures. The spectra of base substitutions in three NMC cases defined by the type of substitutions (i.e. C > A or C > T) and their adjacent bases contexts are plotted in histograms (left). The order of 96 trinucleotide contexts is according to the previous study by Alexandrov et al. [32]. From this data, mutational signatures contributing each case were extracted using the deconstructSigs package, and are depicted in bar graphs (right).

