Figure 3.

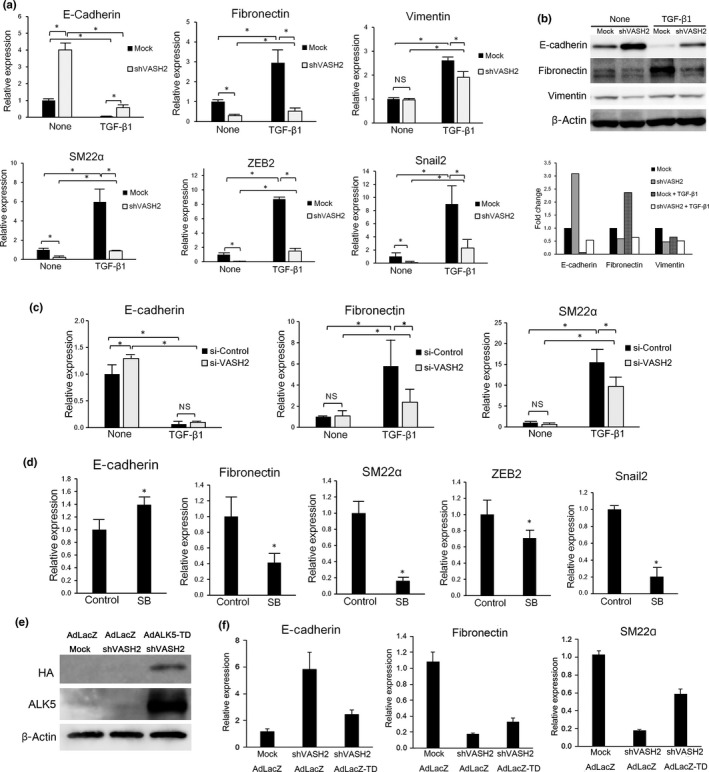
Downregulation of vasohibin‐2 (VASH2) blocks transforming growth factor‐β1 (TGF‐β1)‐induced gene regulation in relation to epithelial–mesenchymal transition. (a) DISS cells transfected with mock or shVASH2 were treated or not with TGF‐β1 for 24 h. Thereafter, quantitative real‐time RT‐PCR analysis of E‐cadherin, fibronectin, vimentin, SM22α, ZEB2, and Snail2 expression was carried out. Values were normalized to the β‐actin mRNA level. (b) DISS cells transfected with mock or shVASH2 were treated or not with TGF‐β1 for 24 h. Thereafter, Western blotting of E‐cadherin, fibronectin, and vimentin was carried out. β‐Actin in the cell lysate was used as a loading control. The densitometric analysis of Western signals is shown in the column graph. The bars indicate the fold change of E‐cadherin, fibronectin, and vimentin expression, normalized to β‐actin and relative to untreated mock. (c) DISS cells transfected with control siRNA or VASH2 siRNA were treated or not with TGF‐β1 for 24 h. Thereafter, quantitative real‐time RT‐PCR analysis of E‐cadherin, fibronectin, and SM22α expression levels was carried out. Values were normalized to the β‐actin mRNA level. (d) DISS cells were treated or untreated (control) with 5 μM SB431542 (SB) for 48 h. Thereafter, quantitative real‐time RT‐PCR analysis of E‐cadherin, fibronectin, SM22α, ZEB2, and Snail2 expression levels was carried out. Values were normalized to the β‐actin mRNA level. (e) Cells were infected with AdLacZ or AdALK5‐TD and incubated for 48 h, then Western blotting of hemagglutinin (HA)‐tag and activin receptor‐like kinase 5 (ALK5) was carried out. (f) Cells were infected with AdLacZ or AdALK5‐TD and incubated for 48 h, then quantitative real‐time RT‐PCR analysis of E‐cadherin, fibronectin, and SM22α expression was carried out. Values were normalized to the β‐actin mRNA level. (a,c,d,f) Mean and SDs are shown (*P < 0.05).
