
Figure 2.
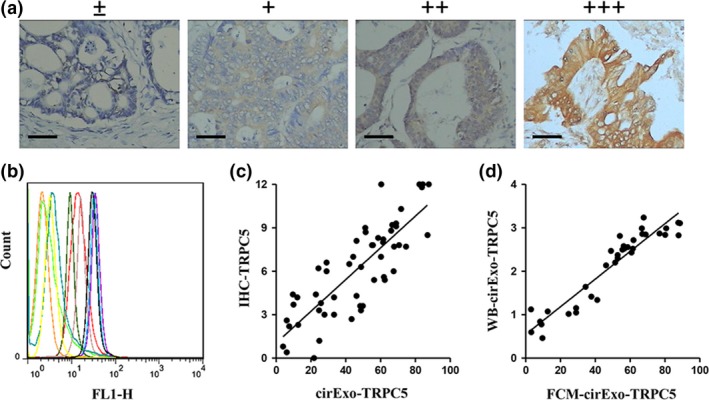
CirExo‐TRPC5 level was correlated with TRPC5 expression level in breast cancer tissues. Representative images from immunohistochemical staining (a) of TRPC5 expression in human breast cancer tissues (scale bars, 100 μM). Flow cytometry (b) showed different cirExo‐TRPC5 levels in plasma from different breast cancer patients. (c) Pearson correlation analysis showed that TRPC5 expression levels in breast cancer tissues were positively correlated to cirExo‐TRPC5 levels (P < 0.001). (d) cirExo‐TRPC5 levels detected by western blot (flotillin1 as the internal reference) (WB‐cirExo‐TRPC5) were significantly positively correlated to cirExo‐TRPC5 levels detected by FCM (FCM‐cirExo‐TRPC5) (P < 0.05).