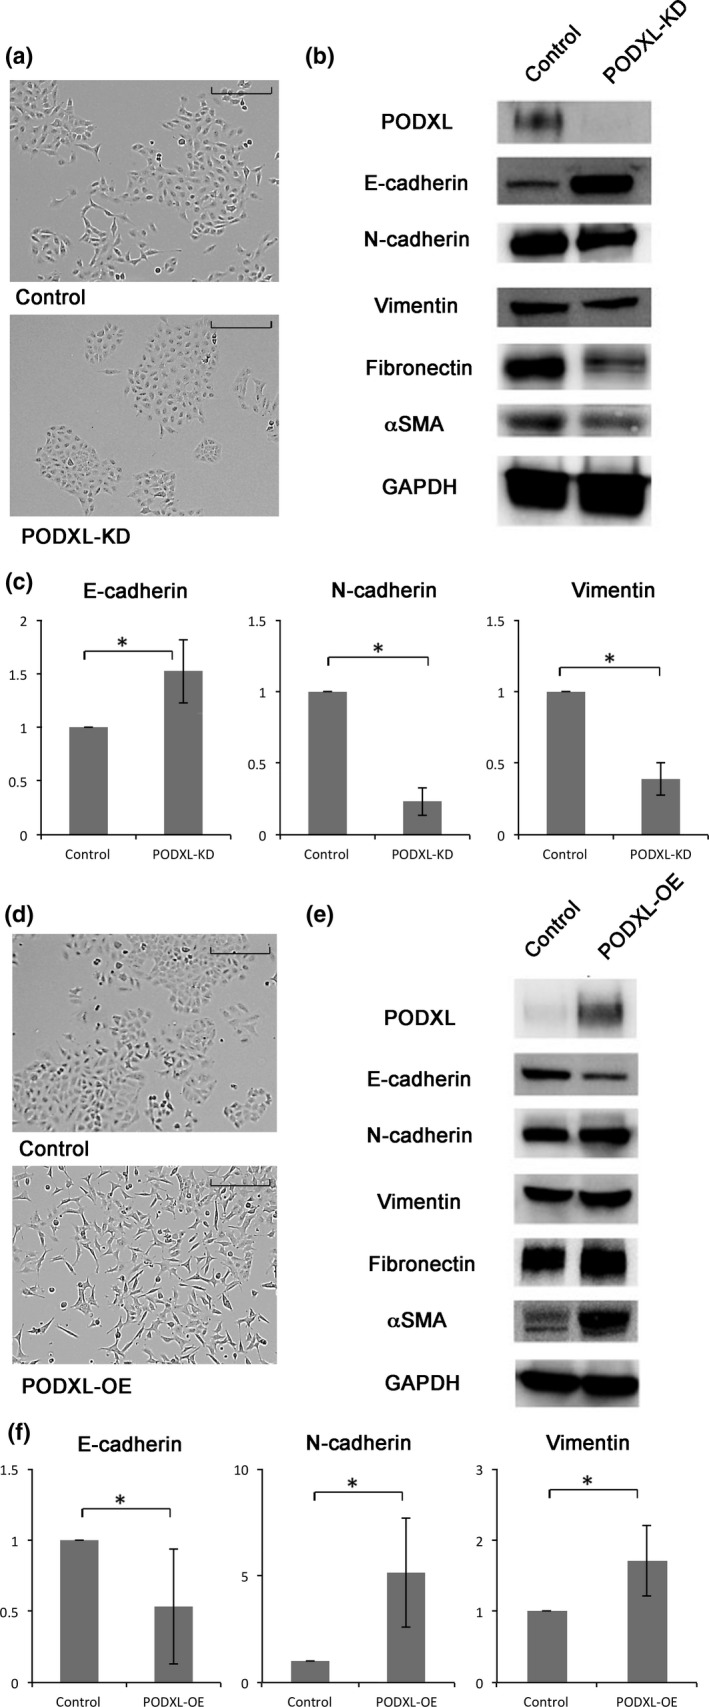
Figure 1.

Cell morphology and epithelial–mesenchymal transition (EMT) marker expression of podocalyxin (PODXL)‐knockdown (KD) and overexpression (OE) cells. (a) The shape of control A549 cells and PODXL‐KD cells was observed under phase contrast. Scale bar = 100 μm. (b) Expression of PODXL, E‐cadherin, N‐cadherin, vimentin, fibronectin and αSMA were measured by immunoblotting in PODXL‐KD cells. (c) Expression of E‐cadherin, N‐cadherin and vimentin was measured by quantitative RT‐PCR in PODXL‐KD cells. The values are the means ± SD of three experiments. *P ≤ 0.05 (Mann–Whitney U‐test). (d) The shape of PODXL‐OE A549 cells was compared under phase contrast microscope. Scale bar = 100 μm. (e) Expression of PODXL, E‐cadherin, N‐cadherin, vimentin, fibronectin and αSMA were measured by immunoblotting in PODXL‐OE cells. (f) Expression of E‐cadherin, N‐cadherin and vimentin were measured by quantitative RT‐PCR in PODXL‐OE cells. The values are shown as above.
